Properties
Los Ricos South
Los Ricos South Mineral Resource Estimate – Pit Constrained and Out-of-Pit(1-9)
|
Mining Method |
Category |
Tonnes |
Average Grade |
Contained Metal |
||||||||
|---|---|---|---|---|---|---|---|---|---|---|---|---|
|
Ag |
Au |
Cu |
AuEq |
AgEq |
Ag |
Au |
Cu |
AuEq |
AgEq |
|||
|
|
|
(M) |
(g/t) |
(g/t) |
(%) |
(g/t) |
(g/t) |
(koz) |
(koz) |
(Mlb) |
(koz) |
(koz) |
|
Pit Constrained5 |
Measured |
2.9 |
150 |
1.13 |
0.03 |
2.96 |
250 |
14,065 |
106 |
1.7 |
278 |
23,446 |
|
Indicated |
2.0 |
107 |
0.74 |
0.03 |
2.07 |
174 |
6,747 |
47 |
1.4 |
130 |
10,974 |
|
|
M&I |
4.9 |
133 |
0.97 |
0.03 |
2.60 |
219 |
20,812 |
153 |
3.1 |
408 |
34,420 |
|
|
Inferred |
0.7 |
108 |
0.66 |
0.03 |
2.00 |
168 |
2,552 |
16 |
0.5 |
47 |
3,979 |
|
|
Pit - Cerro C6 |
Indicated |
0.6 |
43 |
0.90 |
0.01 |
1.43 |
121 |
787 |
17 |
0.1 |
26 |
2,243 |
|
Inferred |
0.3 |
34 |
0.87 |
0.01 |
1.28 |
109 |
377 |
10 |
0.1 |
14 |
1,217 |
|
|
Out-of-Pit7,8
|
Measured |
2.4 |
218 |
2.00 |
0.14 |
4.79 |
405 |
17,025 |
156 |
7.5 |
373 |
31,567 |
|
Indicated |
3.1 |
187 |
2.25 |
0.26 |
4.80 |
407 |
18,525 |
223 |
17.4 |
476 |
40,331 |
|
|
M&I |
5.5 |
201 |
2.14 |
0.20 |
4.79 |
406 |
35,550 |
379 |
24.9 |
849 |
71,898 |
|
|
Inferred |
1.1 |
127 |
1.48 |
0.51 |
3.61 |
306 |
4,544 |
53 |
12.4 |
130 |
10,995 |
|
|
Total |
Measured |
5.3 |
181 |
1.53 |
0.08 |
3.79 |
320 |
31,090 |
262 |
9.2 |
651 |
55,013 |
|
Indicated |
5.6 |
144 |
1.59 |
0.15 |
3.50 |
296 |
26,059 |
287 |
18.9 |
632 |
53,549 |
|
|
M&I |
11.0 |
162 |
1.56 |
0.12 |
3.64 |
308 |
57,150 |
549 |
28.1 |
1,284 |
108,562 |
|
|
Inferred |
2.2 |
106 |
1.11 |
0.27 |
2.70 |
229 |
7,473 |
79 |
13.0 |
191 |
16,191 |
|
- Mineral Resources, which are not Mineral Reserves, do not have demonstrated economic viability. The estimate of Mineral Resources may be materially affected by environmental, permitting, legal, title, taxation, socio-political, marketing, or other relevant issues.
- The Inferred Mineral Resource in this estimate has a lower level of confidence than that applied to an Indicated Mineral Resource and must not be converted to a Mineral Reserve. It is reasonably expected that the majority of the Inferred Mineral Resource could be upgraded to an Indicated Mineral Resource with continued exploration.
- The Mineral Resources were estimated in accordance with the Canadian Institute of Mining, Metallurgy and Petroleum (CIM), CIM Standards on Mineral Resources and Reserves, Definitions and Guidelines (2014) prepared by the CIM Standing Committee on Reserve Definitions and adopted by the CIM Council and CIM Best Practices Guidelines (2019) and have an effective date of January 14, 2025.
- Historically mined areas were depleted from the Mineral Resource model.
- The pit-constrained AgEq cut-off grade of 40 g/t was derived from $1,850/oz Au price, $23.75/oz Ag price, 86% Ag and 95% Au process recovery, $28/tonne process and G&A cost. The constraining pit optimization parameters were $2.10/t mineralized material and waste mining cost, and 45-degree pit slopes.
- The Cerro Colorado Mineral Resource was constrained to open pit mining methods only; Out-of-pit Mineral Resources are restricted to the Eagle and Abra mineralized veins, which exhibit historical continuity and reasonable potential for extraction by cut and fill and longhole underground mining methods.
- The out-of-pit AgEq cut-off grade of 130 g/t Ag was derived from $1,850/oz Au price, $23.75/oz Ag price, 86% Ag and 95% Au process plant recovery, $30/tonne process and G&A cost, and a $60/tonne mining cost. The out-of-pit Mineral Resource grade blocks were quantified above a 130 g/t AgEq cut-off, below the constraining pit shell and within the constraining mineralized wireframes. Out–of-Pit Mineral Resources are restricted to the Eagle and Abra Veins, which exhibit historical continuity and reasonable potential for extraction by cut and fill and longhole mining methods.
- AgEq and AuEq were calculated at an Ag/Au ratio of 86:1 for pit-constrained and out-of-pit Mineral Resources.
- Totals may not sum due to rounding.
Los Ricos South Mineral Reserve
Los Ricos South Mineral Reserve(1-8)
|
Classification |
Tonnage |
Average Grade |
Contained Metal |
||||||
|---|---|---|---|---|---|---|---|---|---|
|
Ag |
Au |
Cu |
AgEq |
Ag |
Au |
Cu |
AgEq |
||
|
(kt) |
(g/t) |
(g/t) |
(%) |
(g/t) |
(koz) |
(koz) |
(Mlb) |
(koz) |
|
|
Underground |
|
|
|
|
|
|
|
|
|
|
Proven |
3,902 |
187.1 |
1.61 |
0.09 |
334.3 |
23,472 |
202 |
7.5 |
41,939 |
|
Probable |
3,611 |
152.0 |
1.70 |
0.18 |
317.8 |
17,647 |
197 |
14.6 |
36,895 |
|
Subtotal Underground |
7,512 |
170.2 |
1.65 |
0.13 |
326.4 |
41,119 |
399 |
22.1 |
78,834 |
|
Open Pit |
|
|
|
|
|
|
|
|
|
|
Proven |
580 |
94.8 |
0.72 |
0.02 |
159.0 |
1,768 |
13 |
0.3 |
2,965 |
|
Probable |
2,140 |
72.1 |
0.64 |
0.03 |
129.7 |
4,961 |
44 |
1.4 |
8,924 |
|
Subtotal Open Pit |
2,720 |
76.9 |
0.66 |
0.02 |
135.9 |
6,728 |
57 |
1.7 |
11,889 |
|
Total |
|
|
|
|
|
|
|
|
|
|
Proven |
4,482 |
175.2 |
1.49 |
0.08 |
311.6 |
25,240 |
215 |
7.7 |
44,904 |
|
Probable |
5,751 |
122.3 |
1.31 |
0.13 |
247.8 |
22,607 |
241 |
16.1 |
45,819 |
|
Total Proven & Probable |
10,233 |
145.4 |
1.39 |
0.10 |
275.7 |
47,847 |
457 |
23.8 |
90,723 |
- Mineral Reserves are based on Measured and Indicated Mineral Resource Classifications only.
- Mineral Reserves are reported using the 2014 CIM Definition Standards and 2019 Best Practices Guidelines and have an effective date of January 14, 2025.
- Mineral Reserves are defined within mine plans and incorporate mining dilution and ore losses.
- Open Pit Mineral Reserves are based on metal prices of $23.75/oz Ag, $1,850/oz Au and $4.00/lb Cu, and are constrained within optimized pit shells and designs that use 45–48º overall wall slopes, and process recoveries of 86% Ag, 95% Au and 51% Cu.
- An Open Pit cut-off grade of 46.4 g/t AgEq is estimated to differentiate ore from waste and is based on cost assumptions of $26.22/t processing, $4.11/t site general and administrative, and 0.5% government mining tax on net revenue. Mining costs are estimated at $2.10/t of ore and waste rock.
- Underground Mineral Reserves are based on metal prices of $23.75/oz Ag, $1,850/oz Au and $4.00/lb Cu, and are constrained within a mine design, and use process plant recoveries of 86% Ag, 95% Au and 77% Cu.
- An Underground marginal cut-off grade of 150 g/t AgEq is estimated to differentiate ore from waste, and is based on cost assumptions of $34.93/t processing, $4.46/t site general and administrative, and mining costs of $41.93/t. An Underground economic cut-off grade of 210 g/t AgEq is estimated to account for capital development costs of $53.86/t in addition to those used to calculate the marginal cut-off grade.
- Totals may not sum due to rounding.
Los Ricos North
Table 1: Los Ricos North Mineral Resource Estimate (1-11)
|
Deposit |
Tonnes |
Average Grade |
Contained Metal |
||||||||||||
|---|---|---|---|---|---|---|---|---|---|---|---|---|---|---|---|
|
Au |
Ag |
Cu |
Pb |
Zn |
AuEq |
AgEq |
Au |
Ag |
Cu |
Pb |
Zn |
AuEq |
AgEq |
||
|
|
(Mt) |
(g/t) |
(g/t) |
(%) |
(%) |
(%) |
(g/t) |
(g/t) |
(koz) |
(koz) |
(Mlb) |
(Mlb) |
(Mlb) |
(koz) |
(koz) |
|
Indicated: |
|
|
|
|
|
|
|
|
|
|
|
|
|
|
|
|
El Favor |
7.7 |
0.27 |
98 |
- |
- |
- |
1.61 |
119 |
68 |
24,413 |
- |
- |
- |
399 |
29,454 |
|
Casados |
3.2 |
0.42 |
124 |
- |
- |
- |
2.09 |
154 |
43 |
12,871 |
- |
- |
- |
218 |
16,061 |
|
La Trini |
3.1 |
0.54 |
74 |
- |
- |
- |
1.54 |
114 |
54 |
7,428 |
- |
- |
- |
155 |
11,424 |
|
Mololoa |
0.4 |
0.36 |
130 |
- |
- |
- |
2.12 |
157 |
5 |
1,788 |
- |
- |
- |
29 |
2,161 |
|
Silver-Gold Oxide Zone |
14.5 |
0.37 |
100 |
- |
- |
- |
1.71 |
127 |
171 |
46,500 |
- |
- |
- |
801 |
59,100 |
|
El Orito Sulfide Zone1 |
7.8 |
0.06 |
28 |
0.11 |
0.88 |
1.33 |
1.55 |
114 |
15 |
7,011 |
19 |
151 |
229 |
389 |
28,708 |
|
Total Indicated |
22.3 |
|
|
|
|
|
1.66 |
122 |
186 |
53,510 |
|
|
|
1,190 |
87,808 |
|
Inferred: |
|
|
|
|
|
|
|
|
|
|
|
|
|
|
|
|
El Favor |
12.4 |
0.27 |
89 |
- |
- |
- |
1.47 |
108 |
106 |
35,505 |
- |
- |
- |
587 |
43,350 |
|
Casados |
1.8 |
0.35 |
108 |
- |
- |
- |
1.82 |
135 |
21 |
6,323 |
- |
- |
- |
106 |
7,843 |
|
La Trini |
0.1 |
0.43 |
108 |
- |
- |
- |
1.89 |
139 |
1 |
201 |
- |
- |
- |
4 |
260 |
|
Mololoa |
0.7 |
0.39 |
94 |
- |
- |
- |
1.66 |
122 |
9 |
2,102 |
- |
- |
- |
37 |
2,739 |
|
Silver-Gold Oxide Zone |
15.0 |
0.28 |
91 |
- |
- |
- |
1.52 |
112 |
136 |
44,131 |
- |
- |
- |
734 |
54,191 |
|
El Orito Sulfide Zone1 |
5.5 |
0.06 |
28 |
0.12 |
0.74 |
1.20 |
1.46 |
108 |
11 |
4,888 |
15 |
90 |
146 |
258 |
19,007 |
|
Total Inferred |
20.5 |
|
|
|
|
|
1.51 |
111 |
148 |
49,019 |
|
|
|
992 |
73,198 |
- El Orito is a silver-base metal sulfide zone, all other deposits are silver-gold oxide zones.
- Mineral Resources which are not Mineral Reserves do not have demonstrated economic viability. The estimate of Mineral Resources may be materially affected by environmental, permitting, legal, title, taxation, socio-political, marketing, or other relevant issues.
- The Inferred Mineral Resource in this estimate has a lower level of confidence than that applied to an Indicated Mineral Resource and must not be converted to a Mineral Reserve. It is reasonably expected that the majority of the Inferred Mineral Resource could be upgraded to an Indicated Mineral Resource with continued exploration.
- The Mineral Resources in this news release were estimated in accordance with the Canadian Institute of Mining, Metallurgy and Petroleum (CIM), CIM Standards on Mineral Resources and Reserves, Definitions and Guidelines (2014) prepared by the CIM Standing Committee on Reserve Definitions and adopted by the CIM Council and CIM Best Practices (2019).
- Historically mined areas were depleted from the Mineral Resource model.
- Approximately 98.9% of the indicated and 91.3% of the Inferred contained AgEq ounces are pit constrained, with the remainder out-of-pit.See tables 4 and 6 for details of the split between pit constrained and out-of-pit deposits.
- The pit constrained AgEq cut-off grade of 29 g/t Ag was derived from US$1,550/oz Au price, US$21/oz Ag price, $3.66$/lb Cu, $0.90 $/lb Pb, $1.26 $/lb Zn, 93% process recovery for Ag and Au, 90% process recovery for Cu, 80% process recovery for Pb and Zn, US$18/tonne process and G&A cost. The constraining pit optimization parameters were $2.00/t mineralized mining cost, $1.50/t waste mining cost and 50-degree pit slopes.
- The out-of-pit AuEq cut-off grade of 119 g/t Ag was derived from US$1,550/oz Au price, US$21/oz Ag price, $3.66$/lb Cu, $0.90 $/lb Pb, $1.26 $/lb Zn, 93% process recovery for Ag and Au, 90% process recovery for Cu, 80% process recovery for Pb and Zn, $57/t mining cost, US$18/tonne process and G&A cost. The out-of-pit Mineral Resource grade blocks were quantified above the 119 g/t AgEq cut-off, below the constraining pit shell within the constraining mineralized wireframes and exhibited sufficient continuity to be considered for cut and fill and longhole mining
- No Mineral Resources are classified as Measured.
- AgEq and AuEq calculated at an Ag/Au ratio of 73.8:1.
- Totals may not agree due to rounding
Figure 1: Pit Constrained Cut-off Sensitivities
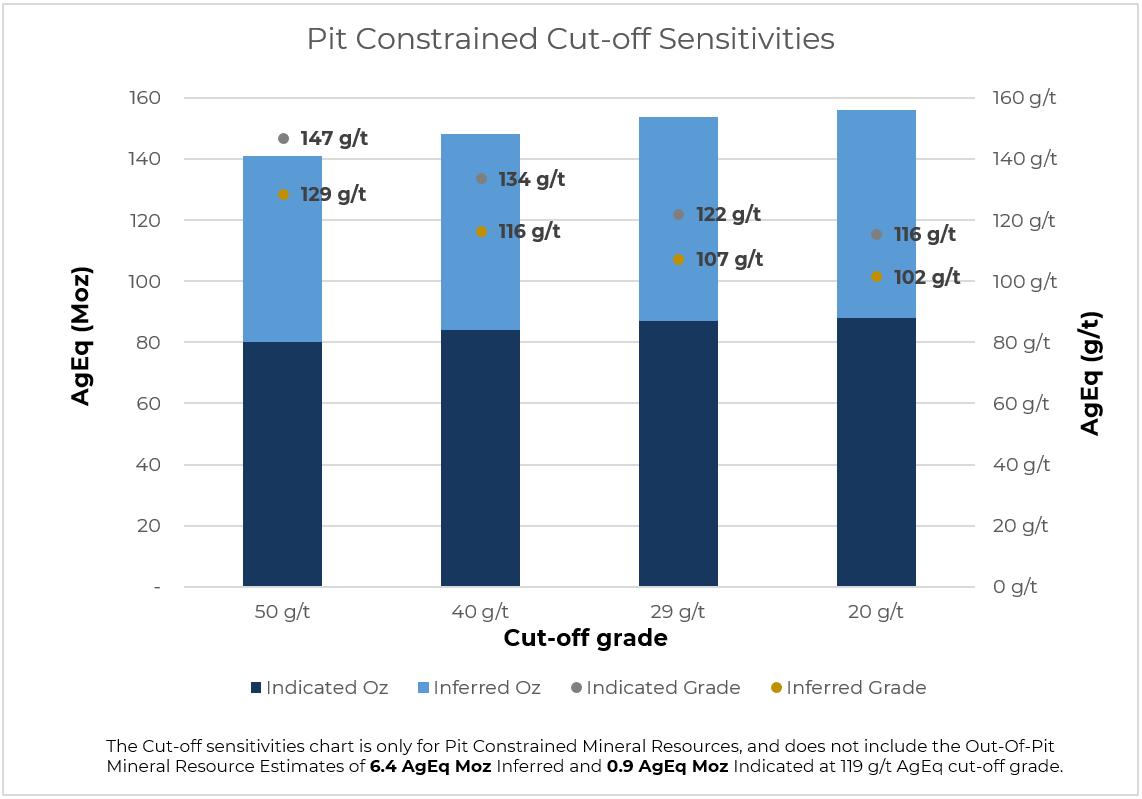
Table 2: Cut-off Sensitivities – Pit Constrained Mineral Resource1
|
|
Cut-off (AgEq) |
Tonnes |
Average Grade |
Contained Metal |
||||||
|---|---|---|---|---|---|---|---|---|---|---|
|
Pit Constrained |
Au |
Ag |
AuEq |
AgEq |
Au |
Ag |
AuEq |
AgEq |
||
|
|
(g/t) |
(Mt) |
(g/t) |
(g/t) |
(g/t) |
(g/t) |
(koz) |
(koz) |
(koz) |
(koz) |
|
Indicated |
50 |
17.0 |
0.31 |
89 |
1.99 |
147 |
170 |
48,811 |
1,088 |
80,288 |
|
40 |
19.5 |
0.28 |
81 |
1.81 |
134 |
177 |
51,061 |
1,138 |
83,951 |
|
|
29 |
22.1 |
0.26 |
74 |
1.65 |
122 |
183 |
52,886 |
1,177 |
86,862 |
|
|
20 |
23.7 |
0.24 |
70 |
1.57 |
116 |
185 |
53,681 |
1,194 |
88,106 |
|
|
Inferred |
50 |
14.7 |
0.26 |
85 |
1.74 |
129 |
121 |
40,312 |
823 |
60,735 |
|
40 |
17.2 |
0.23 |
78 |
1.58 |
116 |
128 |
42,834 |
872 |
64,380 |
|
|
29 |
19.4 |
0.21 |
71 |
1.45 |
107 |
133 |
44,456 |
905 |
66,814 |
|
|
20 |
20.8 |
0.20 |
68 |
1.38 |
102 |
135 |
45,181 |
921 |
67,951 |
|
- See Table 1 notes for assumptions
Parral
Proven & Probable Mineral Reserves – Parral
| Category | Tonnes | Average Grade | Contained Metal | ||||||
|---|---|---|---|---|---|---|---|---|---|
| Au | Ag | AuEq | AgEq | Au | Ag | AuEq | AgEq | ||
| (Mt) | (g/t) | (g/t) | (g/t) | (g/t) | (koz) | (koz) | (koz) | (koz) | |
| Proven | 8.7 | 0.35 | 31.7 | 0.77 | 58 | 76 | 6,897 | 168 | 12,532 |
| Probable | 6.0 | 0.35 | 33.6 | 0.81 | 60 | 68 | 6,525 | 157 | 11,554 |
| Total | 12.8 | 0.35 | 32.6 | 0.79 | 58 | 144 | 13,422 | 325 | 24,086 |
- Mineral Reserves have demonstrated economic viability. The estimate of Mineral Reserves may be materially affected by environmental, permitting, legal, title, taxation, sociopolitical, marketing or other relevant issues.
- The Mineral Reserves in this press release were estimated in accordance with the Canadian Institute of Mining, Metallurgy and Petroleum (CIM), CIM Standards on Mineral Resources and Reserves, Definitions and Guidelines prepared by the CIM Standing Committee on Reserve Definitions and adopted by the CIM Council.
- The Mineral Reserve in this estimate are based on US$1,625/oz Au, US$22/oz Ag, operating costs of US$9.95/t and Au and Ag process recoveries of 65% resulting in a AuEq cut-off grade of 0.30g/t, calculated at an Ag/Au ratio of 73.8:1.
Esmerelda
Mineral Resource Estimate – Esmerelda
| Category | Area | Tonnes | Average Grade | Contained Metal | ||||
|---|---|---|---|---|---|---|---|---|
| Au | Ag | AgEq | Au | Ag | AgEq | |||
| (Mt) | (g/t) | (g/t) | (g/t) | (koz) | (koz) | (koz) | ||
| Measured | Upper | 3.07 | 0.24 | 64 | 85 | 23.5 | 6,339 | 8,395 |
| Lower | 2.60 | 0.29 | 32 | 57 | 24.6 | 2,646 | 4,799 | |
| Total | 5.67 | 0.26 | 49 | 72 | 48.1 | 8,985 | 13,194 | |
| Indicated | Upper | 0.01 | 0.18 | 62 | 78 | - | 12 | 14 |
| Lower | 0.05 | 0.22 | 46 | 65 | 0.3 | 68 | 97 | |
| Total | 0.05 | 0.00 | 48 | 67 | 0.3 | 80 | 112 | |
| Measured & Indicated | Total | 5.72 | 0.26 | 49 | 72 | 48.4 | 9,065 | 13,305 |
- Mineral Resources which are not Mineral Reserves do not have demonstrated economic viability. The estimate of Mineral Resources may be materially affected by environmental, permitting, legal, title, taxation, sociopolitical, marketing or other relevant issues.
- The Mineral Resources in this press release were estimated in accordance with the Canadian Institute of Mining, Metallurgy and Petroleum (CIM), CIM Standards on Mineral Resources and Reserves, Definitions and Guidelines prepared by the CIM Standing Committee on Reserve Definitions and adopted by the CIM Council.
- The Mineral Resource in this estimate are based on US$1,400/oz Au, US$16/oz Ag, operating costs of US$10.14/t and Au and Ag process recoveries of 50% resulting in a AgEq cut-off grade of 41 g/t, calculated at an Ag/Au ratio of 87.5:1.
Company Wide Mineral Resources
|
Deposit |
Tonnes |
Average Grade |
Contained Metal |
||||||||||||
|---|---|---|---|---|---|---|---|---|---|---|---|---|---|---|---|
|
Au |
Ag |
Cu |
Pb |
Zn |
AuEq |
AgEq |
Au |
Ag |
Cu |
Pb |
Zn |
AuEq |
AgEq |
||
|
|
(Mt) |
(g/t) |
(g/t) |
(%) |
(%) |
(%) |
(g/t) |
(g/t) |
(koz) |
(koz) |
(Mlb) |
(Mlb) |
(Mlb) |
(koz) |
(koz) |
|
Measured: |
|
|
|
|
|
|
|
|
|
|
|
|
|
|
|
|
LRS (Oxide)1 |
5.7 |
1.42 |
172 |
0.07 |
- |
- |
3.72 |
291 |
261 |
31,631 |
9 |
- |
- |
686 |
53,703 |
|
Parral2 |
6.8 |
0.35 |
32 |
- |
- |
- |
0.77 |
58 |
76 |
6,897 |
- |
- |
- |
168 |
12,532 |
|
Esmerelda3 |
5.7 |
0.26 |
49 |
- |
- |
- |
0.82 |
72 |
48 |
8,985 |
- |
- |
- |
151 |
13,194 |
|
Total Measured |
18.2 |
- |
- |
- |
- |
- |
1.07 |
79 |
385 |
47,513 |
9 |
- |
- |
1,005 |
79,429 |
|
Indicated: |
|
|
|
|
|
|
|
|
|
|
|
|
|
|
|
|
LRN (Oxide)1 |
14.5 |
0.37 |
100 |
- |
- |
- |
1.71 |
127 |
171 |
46,500 |
- |
- |
- |
801 |
59,100 |
|
LRS (Oxide)1 |
5.4 |
1.45 |
129 |
0.15 |
- |
- |
3.33 |
260 |
250 |
22,210 |
18 |
- |
- |
573 |
44,878 |
|
LRN(Sulfide)1 |
7.8 |
0.06 |
28 |
0.11 |
0.88 |
1.33 |
1.55 |
114 |
15 |
7,011 |
19 |
151 |
229 |
389 |
28,708 |
|
Parral2 |
6.0 |
0.35 |
34 |
- |
- |
- |
0.81 |
60 |
68 |
6,525 |
- |
- |
- |
157 |
11,554 |
|
Esmerelda3 |
0.1 |
0.00 |
48 |
- |
- |
- |
0.77 |
67 |
- |
80 |
- |
- |
- |
1 |
112 |
|
Total Indicated |
33.8 |
|
|
|
|
|
1.77 |
133 |
504 |
82,326 |
37 |
151 |
229 |
1,921 |
144,532 |
|
Measured & Indicated |
52.0 |
|
|
|
|
|
1.75 |
134 |
889 |
129,839 |
46 |
151 |
229 |
2,926 |
223,961 |
|
Inferred: |
|
|
|
|
|
|
|
|
|
|
|
|
|
|
|
|
LRN (Oxide)1 |
15.0 |
0.28 |
91 |
- |
- |
- |
1.52 |
112 |
136 |
44,131 |
- |
- |
- |
734 |
54,191 |
|
LRS (Oxide)1 |
1.4 |
1.22 |
120 |
0.28 |
- |
- |
3.17 |
248 |
54 |
5,325 |
9 |
- |
- |
141 |
11,033 |
|
LRN (Sulfide)1 |
5.5 |
0.06 |
28 |
0.12 |
0.74 |
1.20 |
1.46 |
108 |
11 |
4,888 |
15 |
90 |
146 |
258 |
19,007 |
|
Total Inferred |
21.9 |
|
|
|
|
|
1.61 |
120 |
201 |
54,344 |
24 |
90 |
146 |
1,133 |
84,231 |
- See tables above for LRN and LRS assumptions.
- Parral Mineral Resources are inclusive of Mineral Reserves
- Esmerelda Mineral Resources are based on US$1,400/oz Au, US$16/oz Ag, operating costs of US$10.14/t and Au and Ag process recoveries of 50% resulting in a AgEq cut-off grade of 41 g/t, calculated at an Ag/Au ratio of 87.5:1.
Qualified Persons
Mr. David Duncan, P. Geo. who is a qualified person as defined by National Instrument 43-101, Standard of Disclosure for Mineral Projects, is responsible for, and has reviewed and approved, the scientific and technical information contained on this website pertaining to Los Ricos.
© 2026 GoGold Resources Inc.|TSX:GGD, OTCQX:GLGDF|Disclaimer
Disclaimer: This GoGold Resources Inc. ("GoGold") website may include certain information that may be deemed “forward-looking information”. All statements other than statements of historical fact, included on this website, including, without limitation, statements regarding the Parral tailings project, the Los Ricos project, future operating margins, future production and processing, and future plans and objectives of GoGold, constitute forward looking information that involve various risks and uncertainties. Forward-looking information is based on a number of factors and assumptions which have been used to develop such information but which may prove to be incorrect, including, but not limited to, assumptions in connection with the continuance of GoGold and its subsidiaries as a going concern, general economic and market conditions, mineral prices, the accuracy of mineral resource estimates, and the performance of the Parral project There can be no assurance that such information will prove to be accurate and actual results and future events could differ materially from those anticipated in such forward-looking information.
Important factors that could cause actual results to differ materially from GoGold's expectations include exploration and development risks associated with GoGold’s projects, the failure to establish estimated mineral resources or mineral reserves, volatility of commodity prices, variations of recovery rates, and global economic conditions. For additional information with respect to risk factors applicable to GoGold, reference should be made to GoGold's continuous disclosure materials filed from time to time with securities regulators, including, but not limited to, GoGold's Annual Information Form.
Mr. Robert Harris, P. Eng, who is a qualified person as defined by National Instrument 43-101, Standard of Disclosure for Mineral Projects, is responsible for, and has reviewed and approved, the scientific and technical information contained on this website pertaining to Parral.
Mr. David Duncan, P. Geo. who is a qualified person as defined by National Instrument 43-101, Standard of Disclosure for Mineral Projects, is responsible for, and has reviewed and approved, the scientific and technical information contained on this website pertaining to Los Ricos.